Jeff Sochor
Data Analyst with a background in Digital Asset Management. Skills in SQL, Excel, Tableau, PowerBI, and Access. Extensive experience creating databases, data mapping, cataloging, and Project Management. An excellent problem solver with meticulous attention to detail.
Experience
Logistics Data Analyst
Logistics Data Analyst for the global distribution of Nissan and INFINITI vehicles. Reporting and database management using Access, SQL, Tableau, PowerBI, and Excel. Project manager integrating Tableau office-wide as a visualization tool. Dashboard creation demonstrating global logistics routing with over 7,000 discrete paths.
Data Manager
Data and file manager for Highline Automotive web project. Cleaning, mapping, and consolidating all master data for web development. A large scale project stemming from Highline Automotive acquiring Camco Manufacturing and merging with Warren Distribution requiring new retail website deployment and presence.
Digital Asset Manager
Manage all aspects of database creation, data mapping, cataloging, and coordination of file deliveries. Project Manager for ingestion of acquisition assets into digital repository, DAM hardware, and cloud based content management. Perform metadata collection, quality control, and file verification.
Manager
Created databases by cataloging metadata from projects delivered by freelance contractors and engineers. Project manager overseeing digital repository creation of synchronized RAID array and cloud based archive solutions. Managed sales and reporting, accounts receivable, and social media. Responsible for all technical aspects of a facility specializing in broadcast, post-production, and music recording.
Engineer, VP of Operations
Began as an engineer, promoted to VP of Operations, supervised a staff of 10 engineers and facilities technicians. Trained staff engineers for session work, focusing on signal flow, command of non-linear recording/editing, session etiquette, studio documentation, and master delivery standards.
Education
Vanderbilt University
Berklee College
Hartford Conservatory
Skills
- SQL
- Excel
- Access
- Tableau
- pgAdmin
- HTML
- CatDV
Visualizations
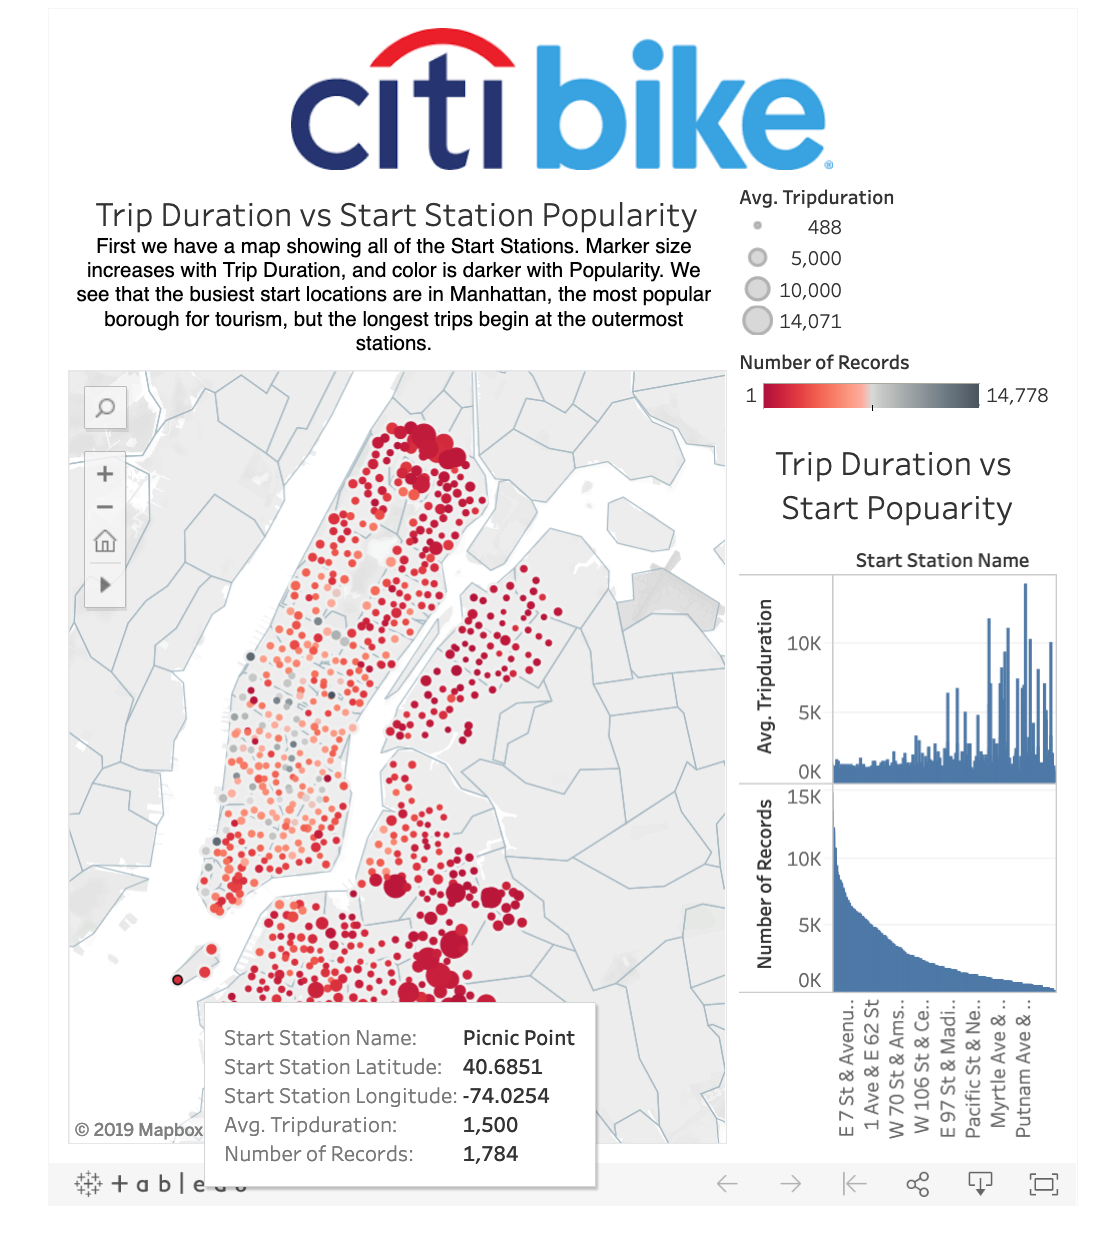
A Tableau visualization of Citi Bike data. Click image to see my public profile with complete story.
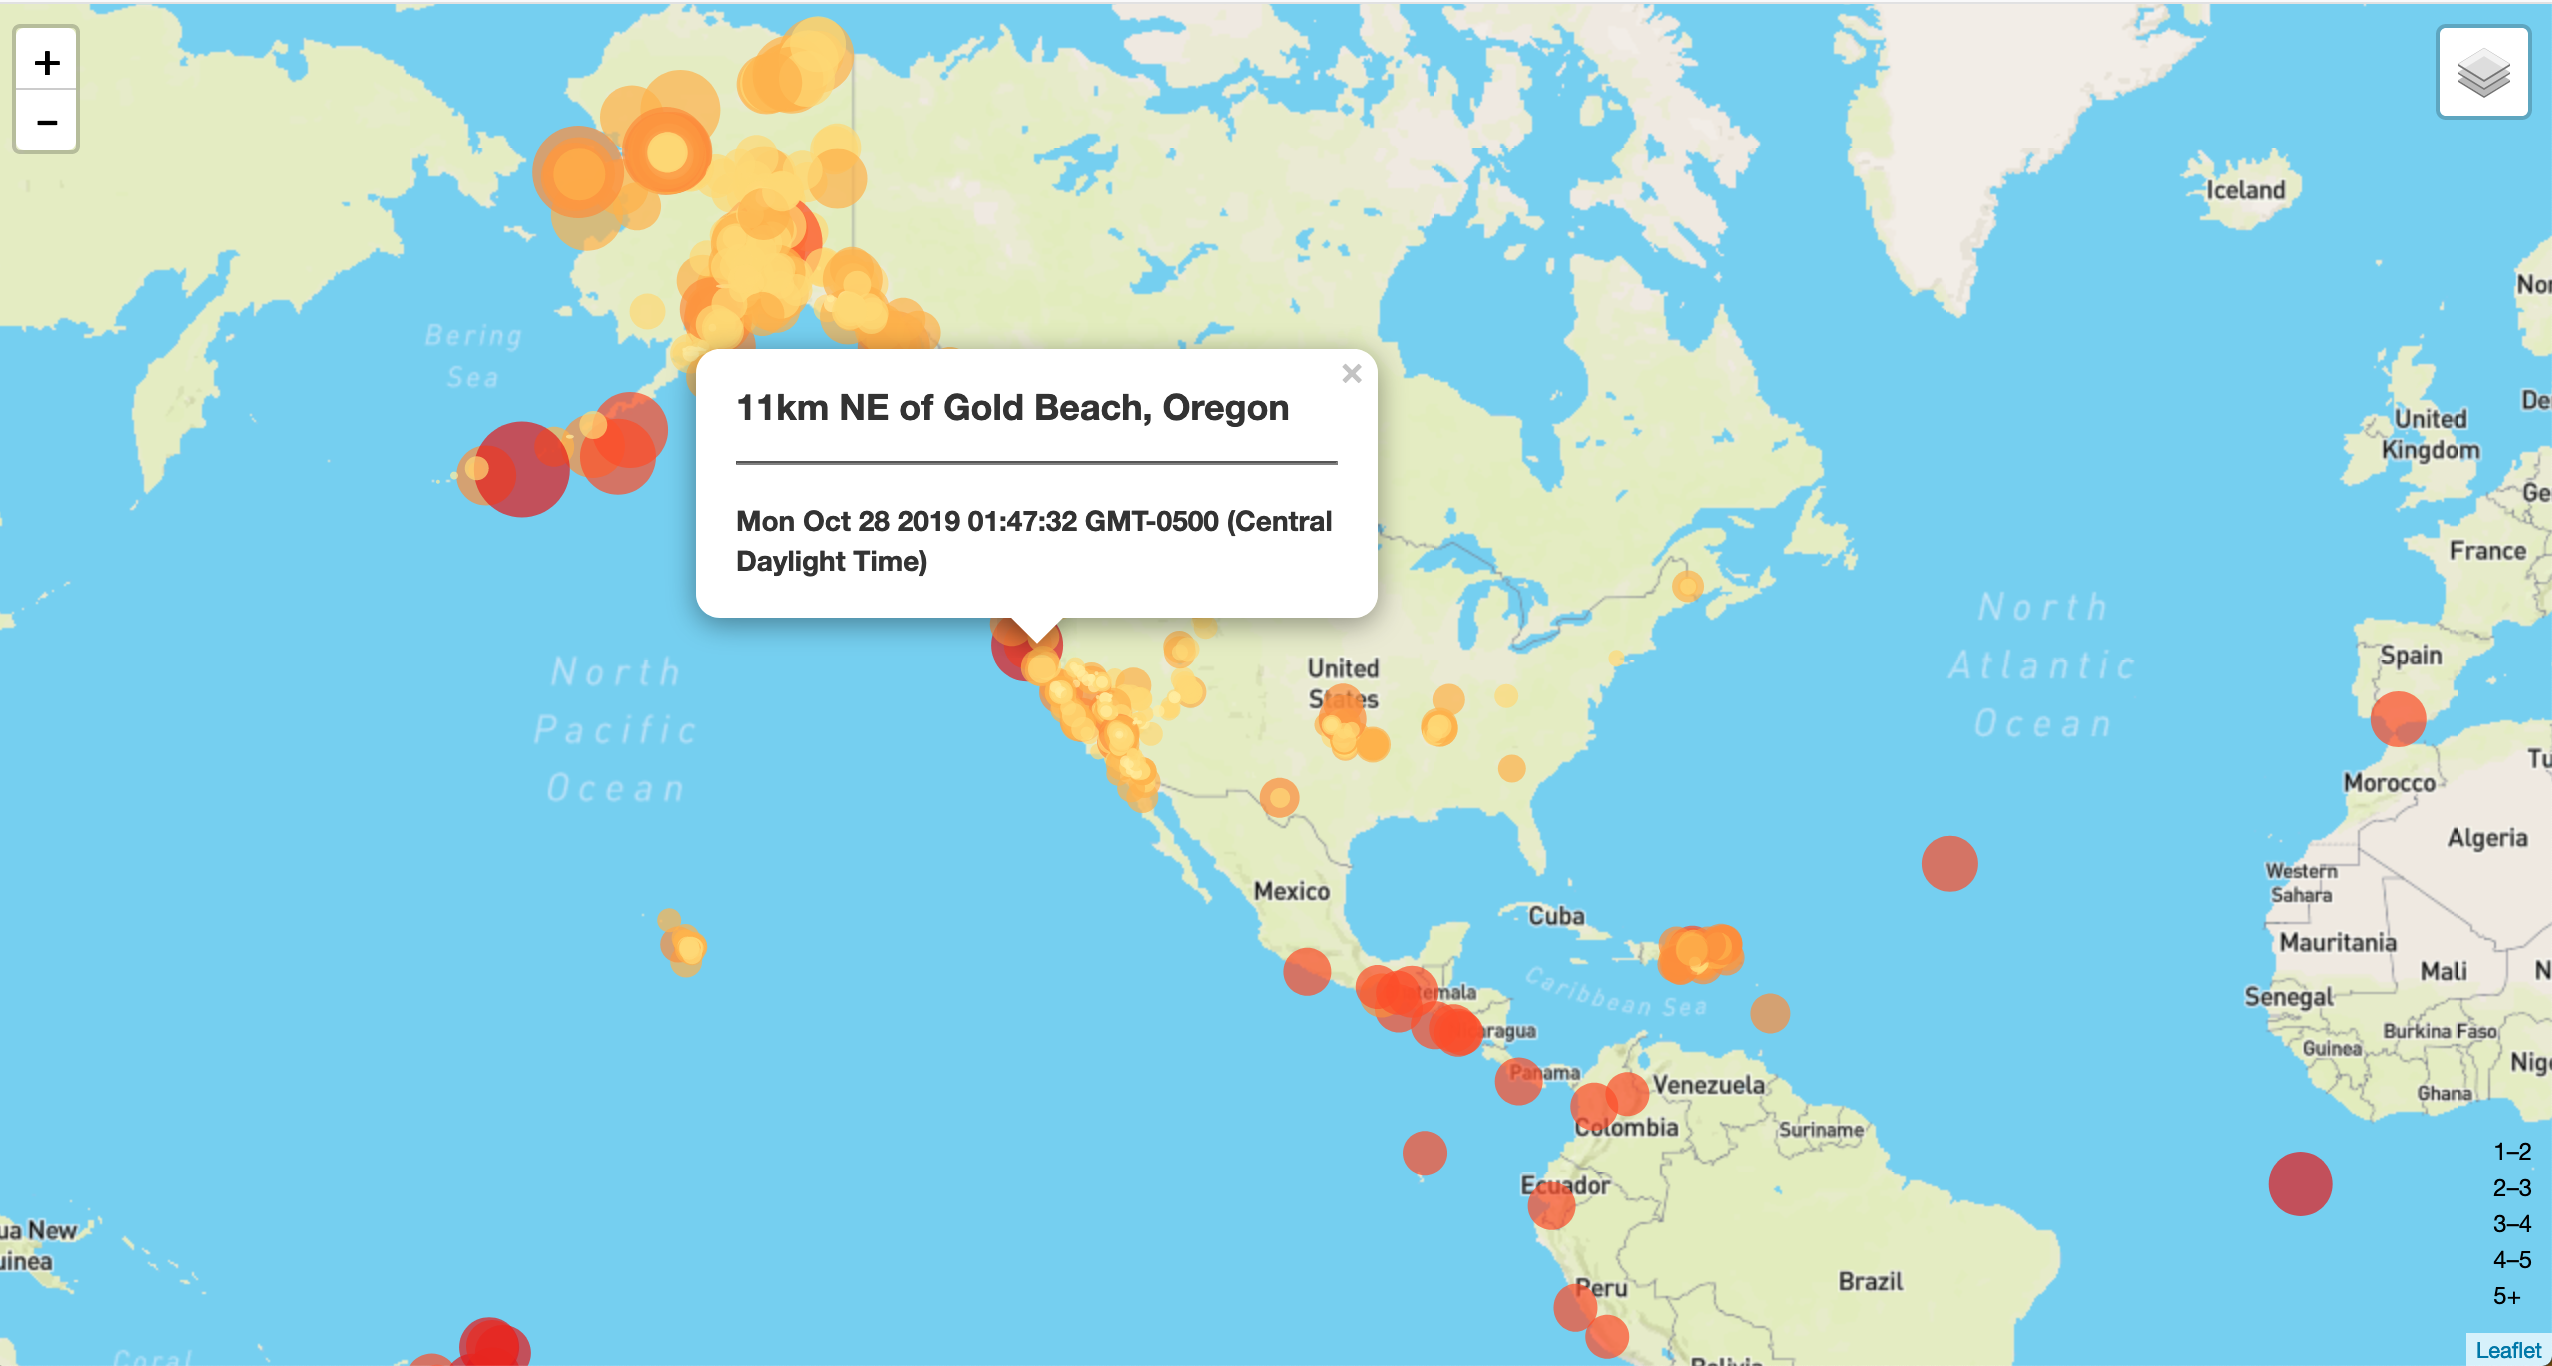
Screen Shot from an analysis of United States Geological Survey Earthquake Data. This is one week of reports, pulled from the API feed of real time GeoJSON data, built with D3.js and Leaflet.
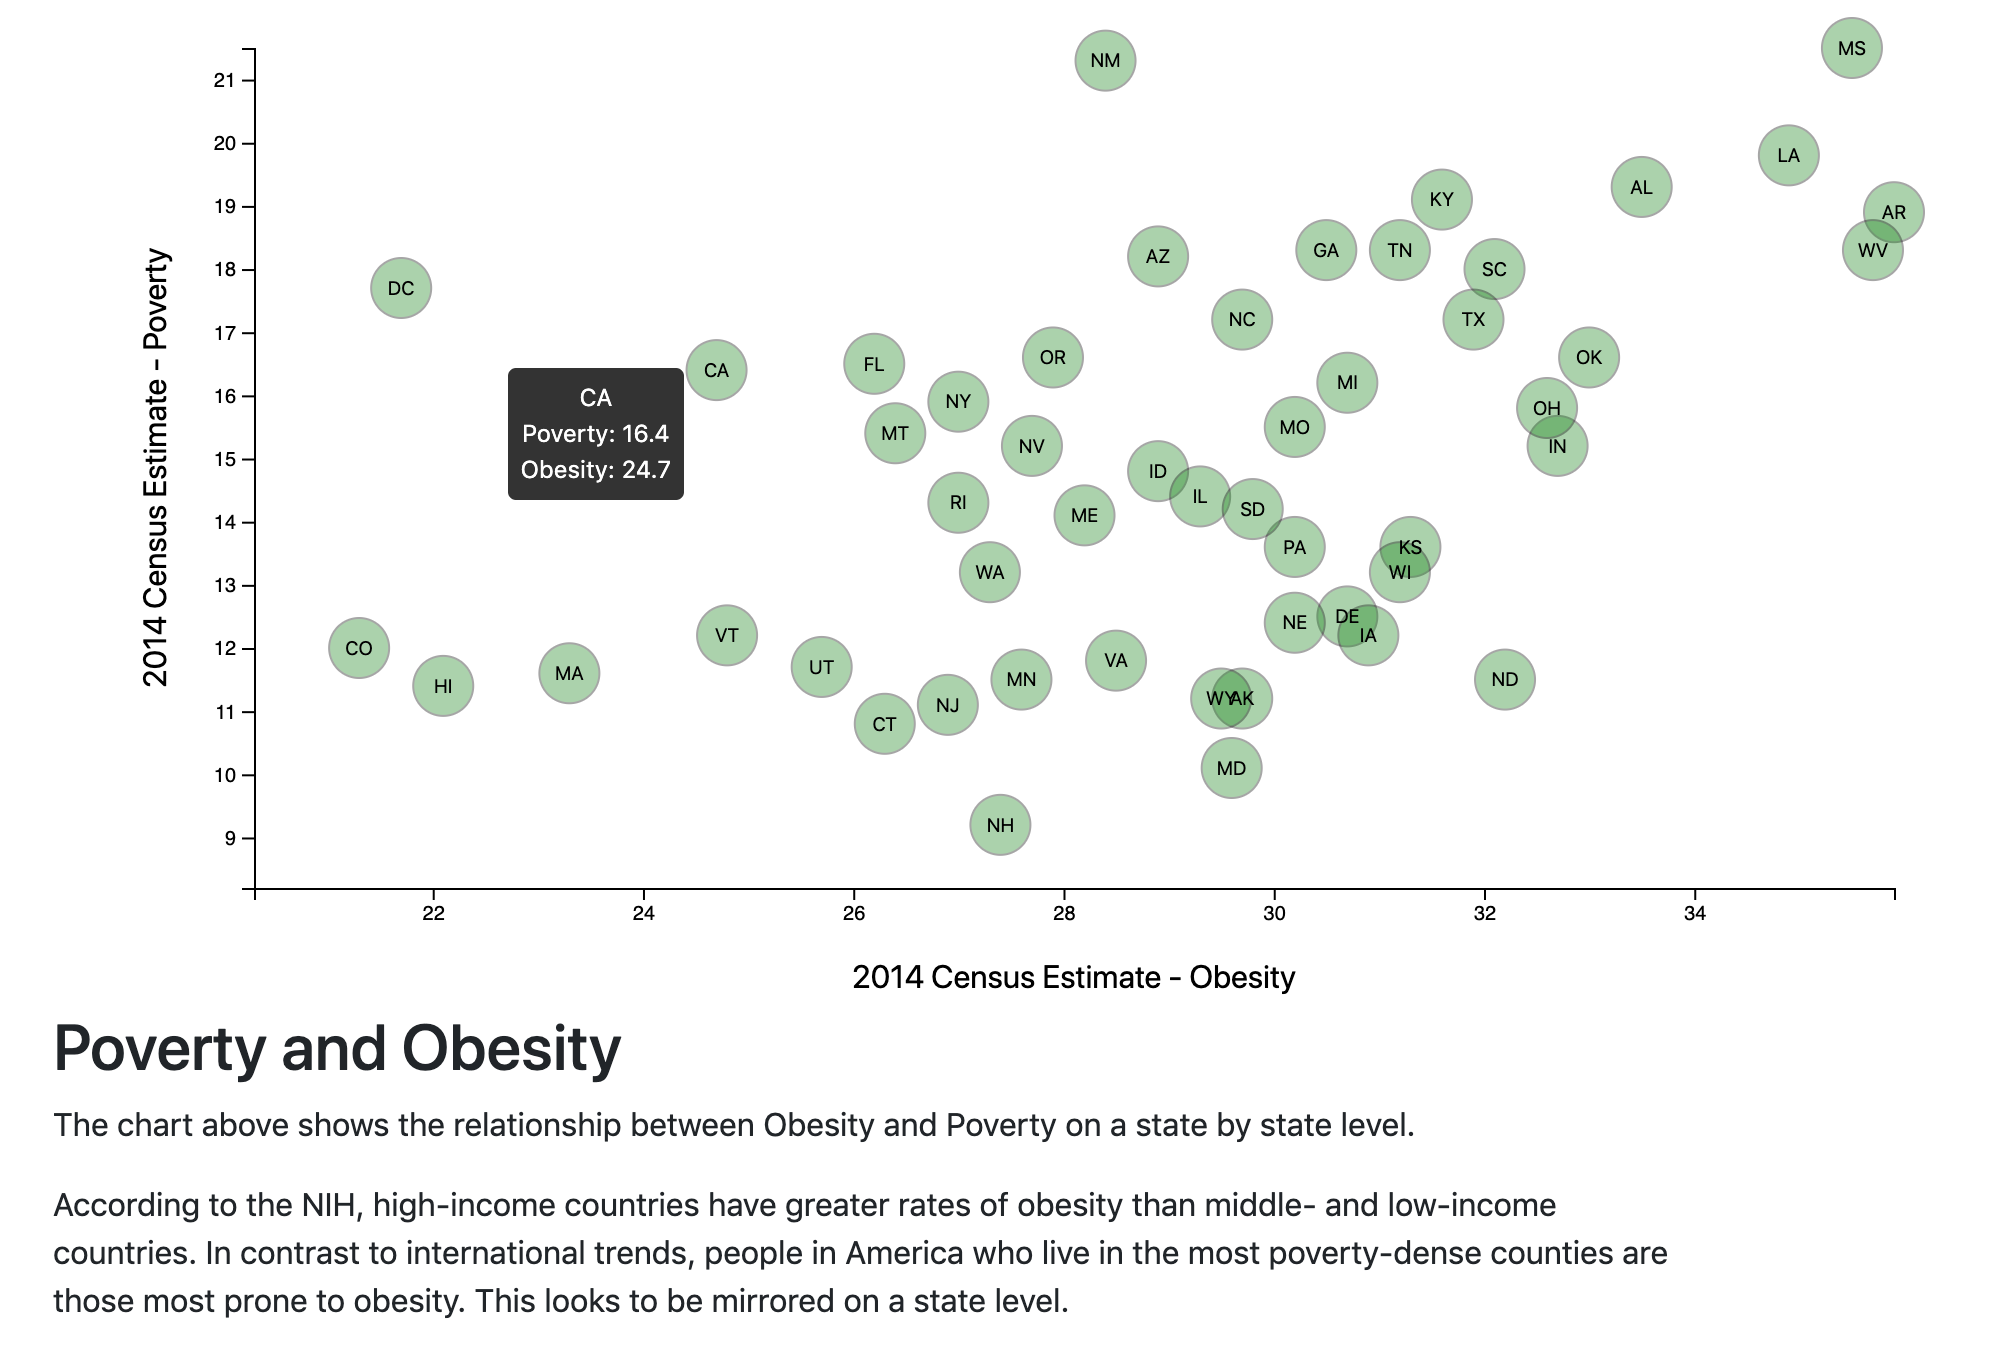
Screen shot from a project comparing poverty to obesity on a state by state basis. SVG will conform to mobile devices, and the tooltip will display exact data points.
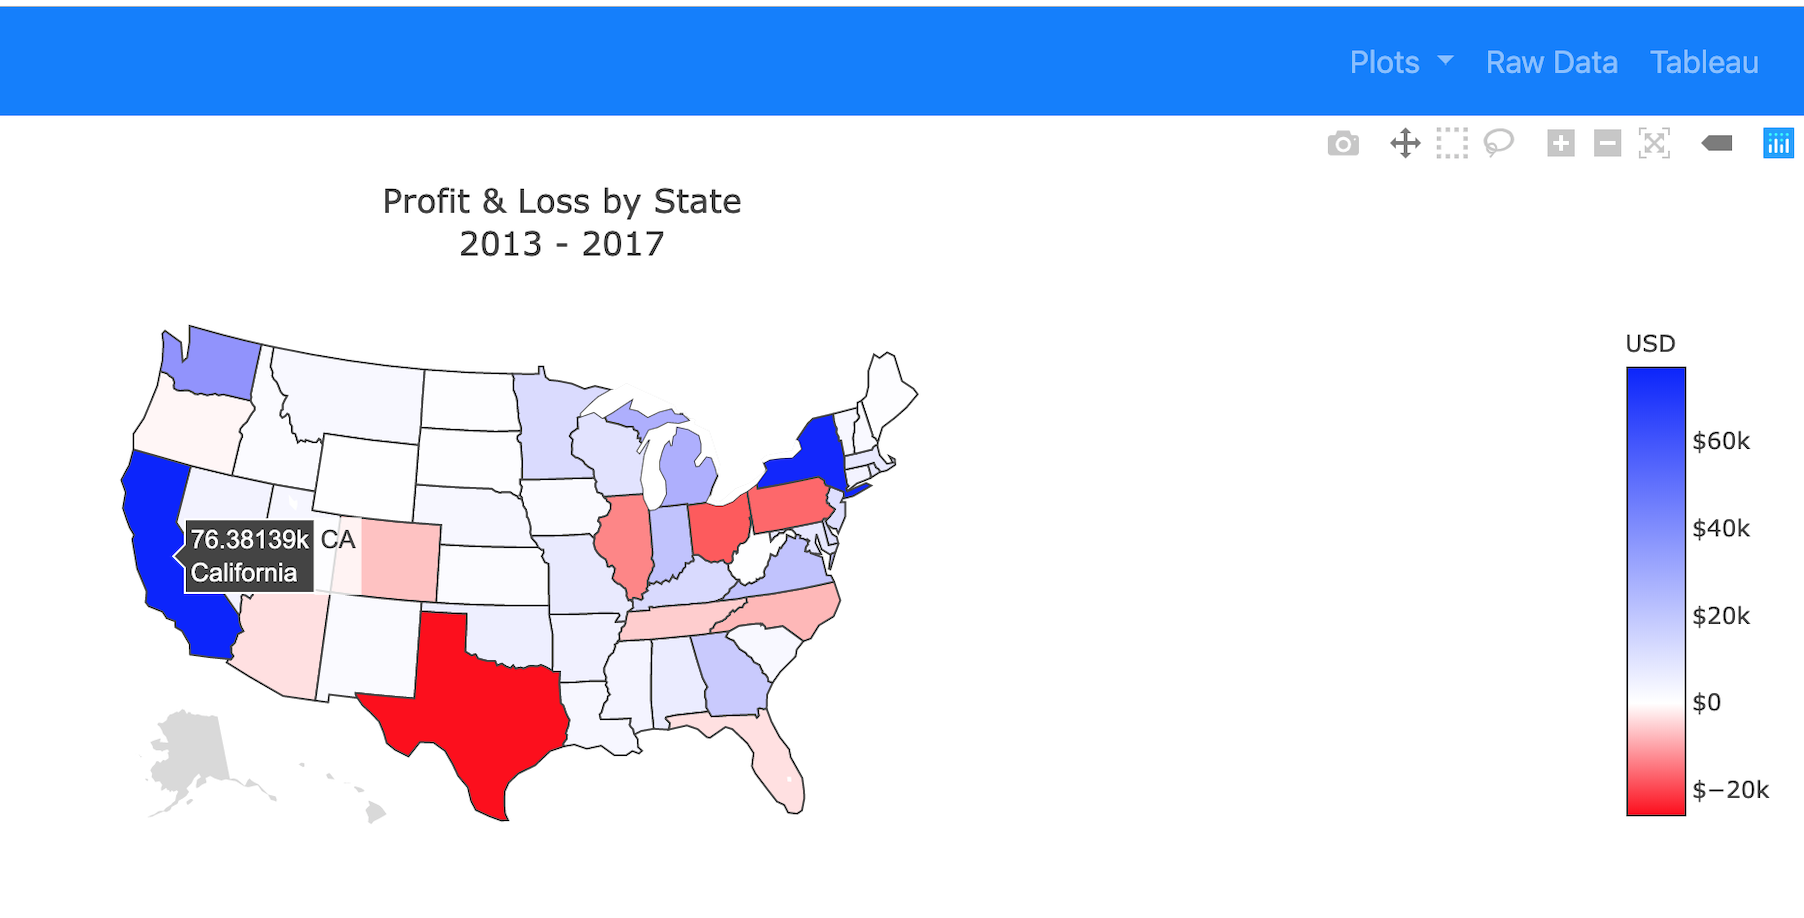
Screen shot of a Choropleth map displaying Profit and Loss covering five years of sales data, from the Plotly graphing library. Data was pulled from a PostgreSQL database using SQLAlchemy. A Flask app was coded in Python to provide RESTful APIs who's routes are accessed in JavaScript, and are also used in our HTML to navigate between our home page, graphs, and raw data.